We provide precision farming services to easily incorporate into your existing farm management, from nutrient mapping to soil sampling, mass data management and agronomy. We work by the addage ‘keep it simple’ as much as possible. By simplifing the data without losing the precision or the important differences within the data. Thus creating more easily used information to aid precision farming management decisions whether soil sampling for nutrient management and fertilizer usage or field walking for crop management. All Willington Crop Services are offered within a 60 mile radius of Bury St Edmunds in Suffolk, Norfolk, Essex and Cambridgeshire focused on wheat and cereal crops.
NUTRIENT MAPPING

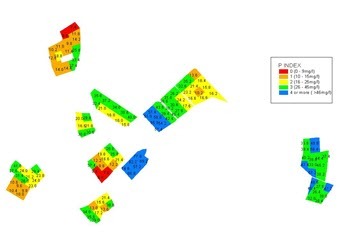
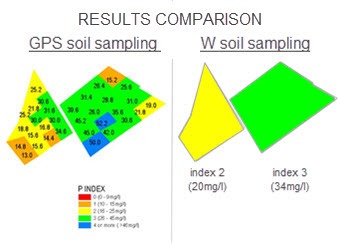
GPS soil sampling, analysis and nutrient mapping to provide detailed soil fertility information for more informed decisions on fertiliser usage. Standard soil analysis is for pH, phosphorus, potassium, & magnesium, but additional factors can easily be added if required. More on our nutrient mapping service.
W SOIL SAMPLING

W soil sampling or conventional soil sampling. Soil cores are collected across the field or field area in a W pattern and the soils analysed as a single sample at an independent laboratory. Standard analysis is for pH, phosphous, potassium & magnesium. Results are interpretted for fertiliser recommendations.
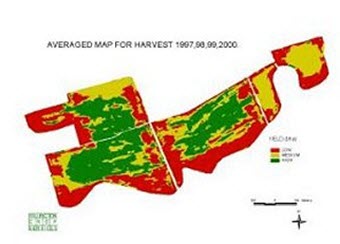
DATA MANAGEMENT

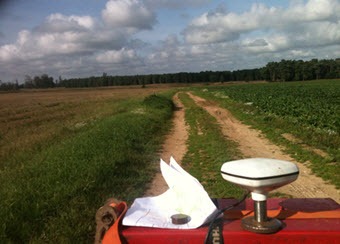
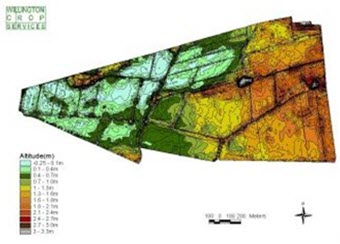
GPS technology on farm machinary now records massive amounts of data on many farms. The challenge is 2 fold, time and the ability to easily highlight the useful differences within the data to aid crop management. We use powerful ArcGIS software to interpolate data and return in a format to suit your software.
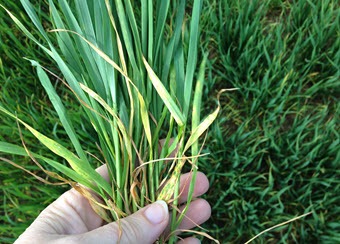
AGRONOMY

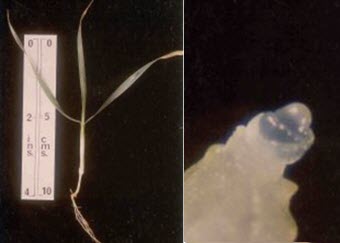
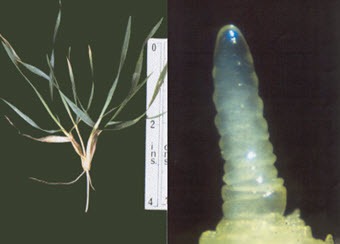
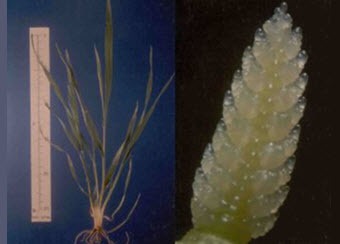
Cereal agronomy service to add precision to farming through optimised timings. Our service includes crop walking, plant dissection to predicted dates of crop stages for optimum window for timing crop management, emailed recommendations. Precise crop stages to prioritise fields and buying. Precision farming services in action.